
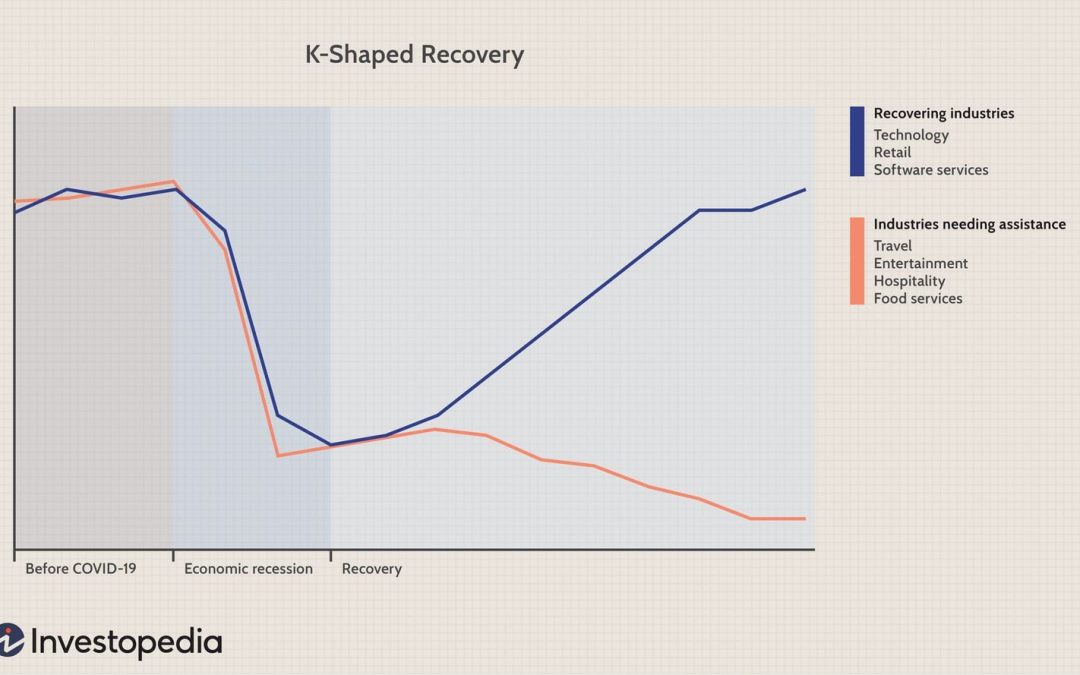
No idea has left a deeper mark on public conversations about markets and the economy in recent years than the “K-shaped economy”, a concept coined in late 2020. The top arm of the K, the richest top 10 per cent of families, is prospering tremendously, while the bottom half of the distribution languishes, punished by inflation without participating, as the rich have, in the boom in financial assets.
This idea has been used to explain everything from resilient consumer spending to corporate earnings surprises, to our vexed political life. Until recently, there has not been much timely data on the distribution of income and wealth, so K-explanation has been more a reflection of the preconceptions of the explainer than a meaningful contribution to our understanding.
Last week, however, new data came in. The 2025 edition of the Federal Reserve’s triennial Survey of Consumer Finances. The SCF gives a multi-dimensional look at Americans’ households by income and wealth cohort, as well as by education, age, race and so on. The crucial takeaway is while the US remains a very unequal place, it has not been getting much more unequal. On most metrics, inequality has hardly increased since the pandemic, and on some it has fallen.
For much of the past 30 years, the top 10 per cent of earners have seen a faster increase than the rest of the distribution. Their median income today, at $400,000, is five times that of families in the middle of the distribution. In 1989, when the study began, the multiple was four. Since 2019, income growth has been the same or slower at the top than at the bottom. And the authors note that in the past three years: “Families in the lower ends of the income and net worth distributions saw modest increases in median and mean income, while families in the upper ends saw declines.”
Note three counterbalancing points. Most importantly, the bottom 25 per cent of the wealth spectrum has had an average net worth of roughly zero since the survey began.
Next, keep an eye on the source of wealth. On the top half of the spectrum, recent increases have been driven by investment portfolios; further down, the dominant appreciating asset is the home. If higher interest rates mean an end to the steady house price appreciation of the past 15 years or so, the wealth gap could widen again.
Finally, the rise in interest rates presents another threat to the poorest Americans. While household leverage is falling, debt costs are rising, and this is showing up in increasing delinquencies.
For more information see Robert Armstrong “Is the K-shaped economy really more of an E?” Financial Times, October 14, 2026.
Recent Comments